What "historical" means on this site, measured
Start with the honest version of the promise, because it is the one thing a chart article usually skips.
| Measure | This dataset |
|---|---|
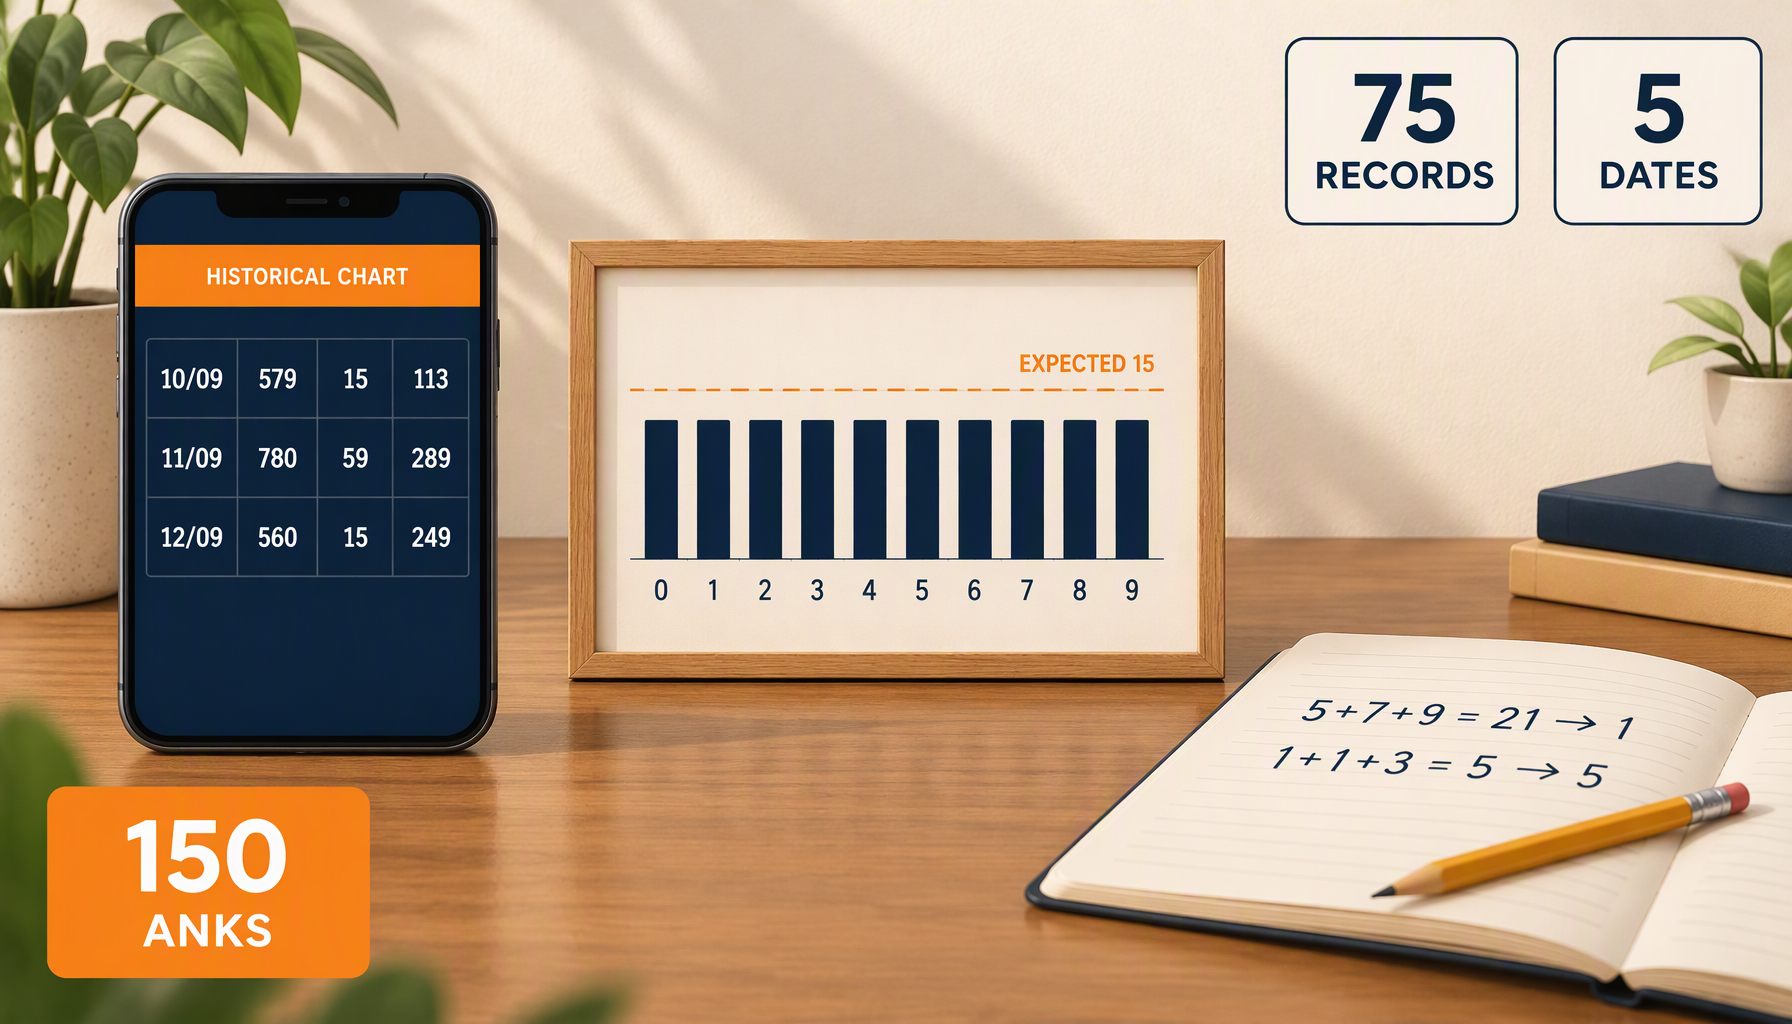
| Complete declared records published | 75 |
| Distinct dates covered | 5 — 10 to 14 September 2026 |
| Markets represented | 19 |
| Records per market | between 1 and 5 |
| Ank observations available for frequency counting | 150 |
| Distinct jodis in the set | 50 of 75 lines |
| Dated rows in the upstream feed, measured 23 October 2026 | 397 across 32 markets |
| Gap in that feed | nothing between 15 September and 11 October 2026, for any market |
So "years of historical data" is not a claim this page can make, and it is worth knowing that before you build an analysis on top of an archive. What exists is a little over a week of declarations plus a five-day September sample. That is enough to verify a format and to demonstrate a statistical point. It is not enough to characterise a market, and every number below is presented with that limit attached.
There is a second limit worth naming: the charts, /results-today/ and the charts index are rendered from a committed snapshot, so they change when the site is rebuilt rather than when a result is declared. The homepage board is the only surface that polls the feed while you watch. Verified satta matka results walks through that split and why it was chosen.
Three things a past record genuinely supports
One: arithmetic. Each line is open pana - jodi - close pana, and the jodi is derived, not drawn: add the three digits of a pana, keep the last digit, and write the two results in order. All 75 published records satisfy that rule, and a line that fails it is not from this data. That is a real test with a real pass rate, and it is the strongest thing a chart can offer.
Two: schedule. Draw days are checkable against the record. Rajdhani Day and Night does this for one market family: of the fifteen afternoon and eleven evening records the upstream feed held for it on 23 October 2026, none of the 26 falls on a day that market does not run — and the six lines this site's own charts publish for the pair sit inside that same schedule. When a chart's dates and its stated schedule disagree, you have found a defect, not a pattern.
Three: counting, with the denominator attached. "Ank 4 has appeared 19 times" is a fact. "Ank 4 is running hot" is an inference, and the difference is the rest of this page.
The frequency test, run on the real archive
Here are all 150 ank observations from the published records, counted by digit:
| Ank | 0 | 1 | 2 | 3 | 4 | 5 | 6 | 7 | 8 | 9 |
|---|---|---|---|---|---|---|---|---|---|---|
| Times appeared | 15 | 19 | 13 | 16 | 15 | 13 | 9 | 14 | 19 | 17 |
| Expected | 15 | 15 | 15 | 15 | 15 | 15 | 15 | 15 | 15 | 15 |
| Deviations from expected | 0 | +1.1 | −0.5 | +0.3 | 0 | −0.5 | −1.6 | −0.3 | +1.1 | +0.5 |
The spread of a count like this is roughly √(n × p × (1−p)) — with 150 observations and ten equally likely digits, about 3.67. Read against that number, the extremes are ordinary: the rarest ank is 1.6 deviations low, the joint-most-common are 1.1 high. A chi-square goodness-of-fit test over the ten cells returns 5.47 on nine degrees of freedom, which is nowhere near a rejection. Probability in number games runs that test in full and explains what the degrees of freedom mean.
The practical rule: before you call any digit hot or cold, ask what the wiggle room is. On a small archive it is wide, which is exactly why two sites can publish opposite "hot numbers" from the same week of results and both be describing their data honestly.
How much history a frequency claim actually needs
This is the part most chart write-ups skip, and it is simple arithmetic. Suppose an ank really did come up 12 per cent of the time rather than 10 — a genuine 20 per cent edge, the kind a "trend" post would treat as obvious.
| Sample size | Expected count for a 12% ank | Gap from the fair 10%, in standard deviations | Verdict |
|---|---|---|---|
| 150 (this archive) | 18 | 0.8 | invisible |
| 325 | 39 | 1.2 | still not evidence |
| 901 | 108 | 2.0 | two-sigma territory |
| 2,026 | 243 | 3.0 | clears three sigma |
Solving that inequality for a three-sigma result gives roughly 2,026 observations; for two sigma, about 901. A much larger tilt shows up sooner — an ank running at 15 per cent rather than 10 needs only about 325 observations to clear three sigma — but a 20 per cent relative edge is precisely the size that looks obvious in a small table and is invisible in one. This site publishes 150. So the archive is not merely small for comfort — it is small by an order of magnitude, and no amount of careful reading fixes that. Only more declarations do. A single market makes the point even more sharply: Time Bazar's chart pages hold four lines, and its upstream feed held 17 complete records — 34 ank observations — when measured on 27 October 2026, which is under 4 per cent of the 901 this table needs for a two-sigma reading. The worked numbers are in the Time Bazar timing and chart guide.
Note what this does and does not say. It is not proof that draws are fair; it is a statement about what this sample can detect. And the flip side matters more: a large archive would not make the next number predictable either. If the draws are independent, more data sharpens your ability to say "no bias detected" and does nothing for forecasting. Statistical power and forecastability are different properties, and a chart page that promises the second is selling the first.
The one pattern the record does confirm
There is a place where past charts genuinely teach you something, and it is not about which numbers come up — it is about the shape of the number space the draws are drawn from.
| Property | Expected from the number space | Observed in 150 published panas |
|---|---|---|
| Red pana (any two of three digits match) | 28.0% — 280 of 1,000 combinations | 32, or 21.3% |
| Panas with three different digits | 72.0% | 118, or 78.7% |
| Panas with exactly one repeated digit | 27.0% | 31, or 20.7% |
| Panas with all three digits equal | 1.0% | 1, or 0.7% |
The first row is the interesting one, because the expected figure is arithmetic rather than a guess: of the 1,000 possible three-digit panas, 720 have three distinct digits, so 280 must repeat one. The observed 21.3 per cent is below that, about 1.8 standard deviations — the sort of gap a 150-item sample throws up without anything being wrong.
That is the legitimate use of a historical chart: it lets you check whether what you are looking at is consistent with the structure of the game. When a site's "hot number" table shows an ank appearing 40 per cent of the time, the number space itself tells you something is off with the table, not with the market. The vocabulary for reading those rows is on the glossary and in Understanding Jodi and Pana.
Five ways people read history wrong
- The due-number error. A digit that has not appeared recently is not owed an appearance. Independence is the assumption the whole frequency table above rests on, and it does not expire because a streak looks long.
- Window shopping. Choose your own start date and you can find a run supporting almost anything. State the window before counting, not after.
- Counting lines as if they were draws. A pana chart cell stacks three printed numbers. Counting 150 digits and calling it 150 events halves the denominator twice over — the same trap the odds guide has to navigate.
- Reading blanks as results. A
***is a non-declaration, and the reasons for it are three different things, as how to read pana and jodi charts sets out. - Transferring a pattern between markets. Each market keeps its own record; a Milan sequence says nothing about Kalyan. The two-hour windows and shared opening minutes are in popular Matka markets and open, close and timings.
What to do with a chart instead
- Verify before you interpret. Add the digits, compare the jodi, check the date against the market's draw days. This takes seconds and it is the only step that can fail loudly.
- Attach the denominator. "19 of 150" is a claim you can test; "19 times" is a headline.
- Compare against the number space, not against a feeling. 28 per cent of panas must be red; 72 per cent must have three distinct digits. Those are the only expectations a small archive can be checked against honestly.
- Treat every "trend" as a request for more data. If a page cannot say how many draws it looked at, it has not done the first step.
- Check which space you are counting. All 154 pana observations on these charts are written in the app's canonical order — non-descending, with 0 ranked highest — and their 78/21/1 shape split matches a draw over 1,000 triples rather than a pool of 220 equally likely forms. Understanding “Single Digit” and “Double Patti” game formats reconciles the two counts.
- Ask how much of the archive the page is actually showing. This site's charts carry 75 complete dated rows while the endpoint behind them served 378 for the same 19 markets on 29 October 2026 — 19.8 per cent. The evolution of digital satta matka platforms in India counts that gap market by market, and shows the same archive rendering live in the Android app.
- Know what the sample cannot detect. Random number generation explained works out that a market drawing one ank at half the fair rate lifts the standard statistic by only 2.08 at this archive's size, where a fair run already swings by 4.24 — so "no bias found" is not "no bias present". Supreme Day and Night: What You Need to Know measures the same gap from the other direction: 25 rows available from the feed against the 5 a Supreme chart page holds.
Then look at the record yourself: the charts index lists all nineteen markets with their windows and draw days, each market has a pana chart and a jodi chart, and today's latest declarations by market prints the newest line held for each. Count the rows before you trust any summary of them, including this one.
What it costs to deliver those rows is a separate measurement, and it is made in the open on why mobile optimization matters for live result platforms — a page that times this one among the five it loads on a throttled phone profile.
Mama567 records declared results. It takes no wagers, sells no tips, and presents no number as likelier than another; satta matka is illegal in most Indian states, and nothing above is advice. 18+ only.
For information only. Mama567 publishes results and charts, and does not offer predictions or guessing services. Adults 18+.