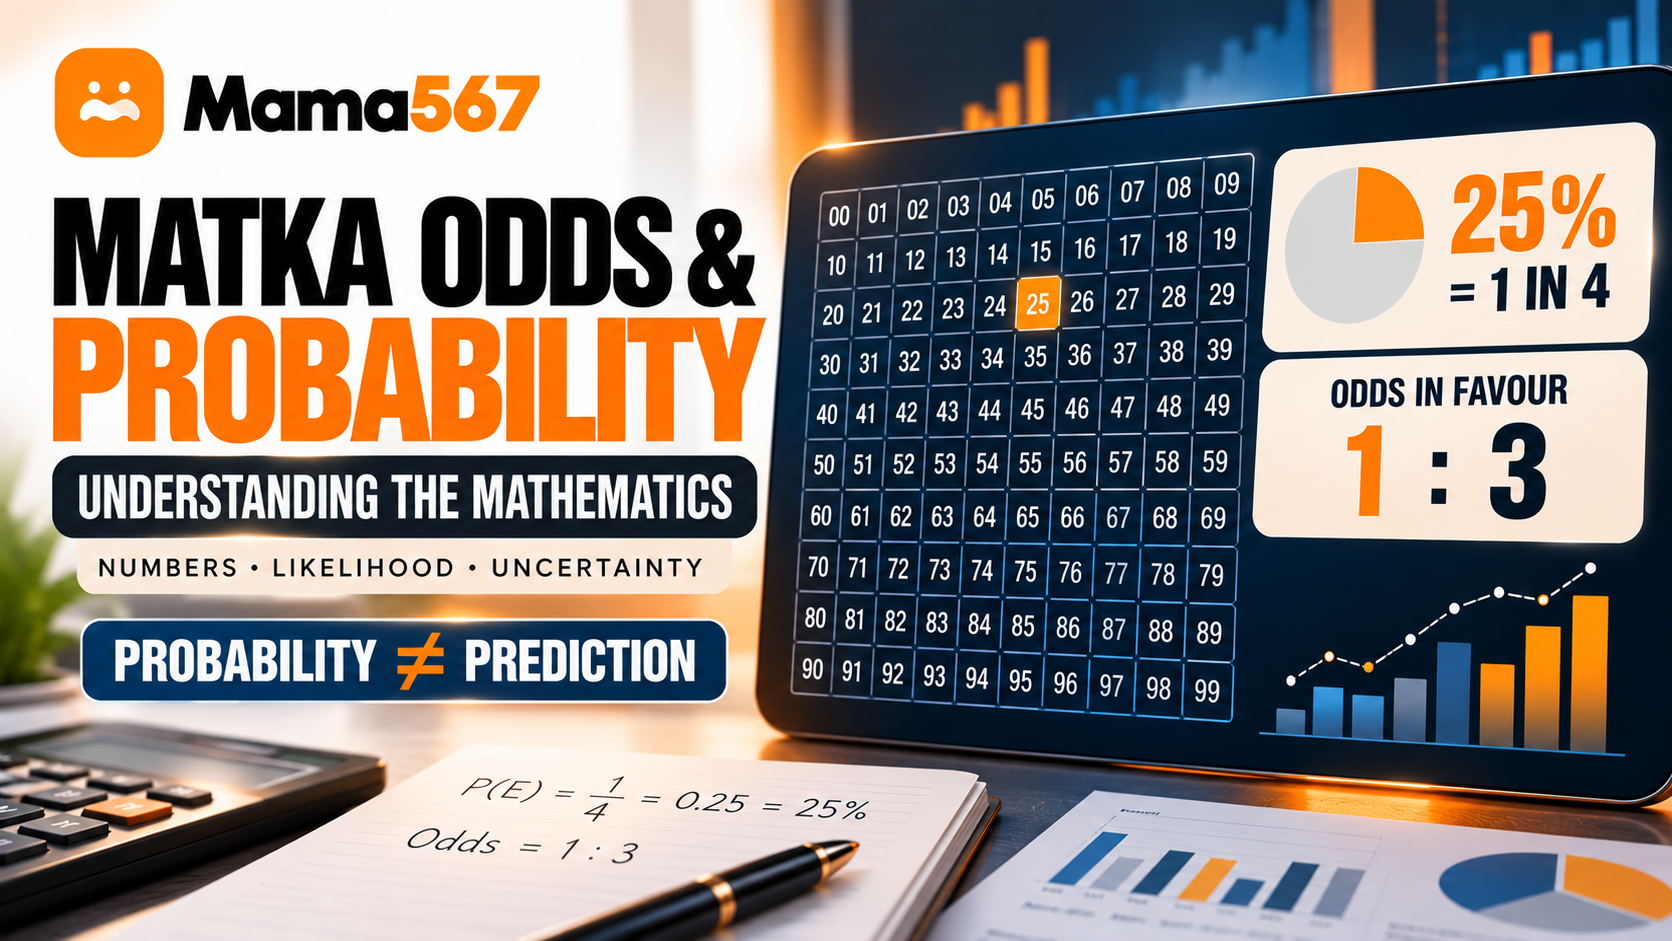
In discussions surrounding Indian satta matka markets, terms like "probability," "odds," "rates," and "calculations" are frequently used interchangeably. Many enthusiasts assume that mathematical formulas can unlock hidden sequences, that historical boards reveal "due" numbers, or that advertised payout rates reflect actual statistical likelihoods.
In mathematics, probability, odds, and payout rates are distinct concepts governed by strict rules of arithmetic. Confusing these ideas leads to false expectations and misunderstandings about how uncertainty works.
This analysis provides an educational examination of probability and odds using classical mathematical definitions. We examine how sample spaces are counted, how probability differs from odds ratios, why historical result charts cannot forecast future declarations, and why payout rates must never be mistaken for mathematical probabilities.
This article is designed strictly for educational and informational purposes. It does not provide betting strategies, number tips, guessing formulas, or gambling encouragement. For background on game formats and vocabulary, refer to our foundational guides on Matka Bet Types Explained and Jodi and Pana Terminology.
What Does Probability Mean?
In probability theory, probability is a numerical value between 0 and 1 (or 0% and 100%) that expresses how likely an event is to occur within a defined set of possibilities.
A probability of 0 denotes an impossible event; a probability of 1 denotes an absolute certainty. Values in between indicate varying degrees of likelihood under a given mathematical model.
When every outcome in a scenario has an equal chance of occurring, probability is calculated using the classical formula:
P(E) = Number of favourable outcomes / Total possible outcomes
Where:
P(E)represents the probability of event $E$.- Favourable outcomes are the specific results you are measuring.
- Total possible outcomes is the entire set of all possible results (the sample space).
A Non-Gambling Everyday Example
Consider an opaque bag containing 4 marbles: 1 red marble and 3 blue marbles. If you reach into the bag and draw one marble at random:
- Total possible outcomes =
4 - Favourable outcome (drawing a red marble) =
1 - Calculation:
P(Red) = 1 / 4 = 0.25 = 25%
The probability of drawing a red marble is strictly 25%. Notice that this calculation requires two prerequisites:
- A known, complete set of outcomes (4 marbles).
- The assumption that every marble has an identical physical chance of being selected.
If you do not know how many marbles are in the bag, or if some marbles are larger than others, the simple fraction formula no longer applies. In real-world systems, one cannot assume equal likelihood without verified physical or empirical proof.
What Is the Difference Between Probability and Odds?
While everyday speech often treats "odds" and "probability" as synonyms, mathematics draws a precise distinction between them.
- Probability measures the ratio of favourable outcomes to all possible outcomes: $\text{Probability} = \frac{\text{Favourable}}{\text{Total}}$
- Odds in Favour measure the ratio of favourable outcomes directly against unfavourable outcomes: $\text{Odds in Favour} = \text{Favourable} : \text{Unfavourable}$
- Odds Against reverse that comparison: $\text{Odds Against} = \text{Unfavourable} : \text{Favourable}$
For any event with probability $p$, the odds in favour are expressed as $p : (1 - p)$, and the odds against are $(1 - p) : p$.
Comparing Probability and Odds
Returning to our 4-marble example (1 red, 3 blue):
| Measurement | Formula / Ratio | Value for Red Marble | Plain-Language Meaning |
|---|---|---|---|
| Probability (Fraction) | $\frac{\text{Favourable}}{\text{Total}}$ | $\frac{1}{4}$ | 1 chance out of 4 total attempts |
| Probability (Percentage) | $(\frac{\text{Favourable}}{\text{Total}}) \times 100$ | $25%$ | Occurs in 25 out of 100 hypothetical trials |
| Odds in Favour | $\text{Favourable} : \text{Unfavourable}$ | $1 : 3$ | 1 win for every 3 losses |
| Odds Against | $\text{Unfavourable} : \text{Favourable}$ | $3 : 1$ | 3 losses for every 1 win |
Notice how the numbers differ: a probability of $25%$ corresponds to odds against of 3 to 1, not 4 to 1. The denominator in probability represents the whole, whereas odds represent the ratio of parts.
Understanding Possible Outcomes in a Jodi Format
In matka terminology, a Jodi is a two-digit number formed by combining the single open ank with the single close ank. We can construct an illustrative mathematical model to understand how sample spaces work.
The two-digit labels range from 00 through 99:
{ 00, 01, 02, 03, 04, 05, 06, 07, 08, 09,
  10, 11, 12, 13, ...,
  90, 91, 92, 93, 94, 95, 96, 97, 98, 99 }
Counting the Sample Space
Counting every two-digit integer from 00 to 99 yields exactly 100 possible labels:
00through09: 10 outcomes10through19: 10 outcomes- Continuing through
90through99: 10 rows of 10 = 100 total outcomes.
Calculating Theoretical Jodi Probability
Under a hypothetical, idealized model where every one of the 100 two-digit outcomes is assumed to be equally likely: $\text{P(Specific Jodi)} = \frac{1}{100} = 0.01 = 1%$ $\text{Odds Against Specific Jodi} = 99 : 1$
Under this uniform model, any specific combination (whether it looks symmetrical like 55, sequential like 12, or begins with zero like 08) shares the identical theoretical probability of 1%.
Theoretical Model vs. Real-World Market Declarations
It is vital to understand that the $1%$ figure is a mathematical baseline derived from a theoretical uniform assumption. It does not constitute an empirical measurement of any live Mama567 market.
Mama567 publishes declared result records as reported from external market organizers; it does not operate random number generators or publish statistical distribution audits. Never assume that a real-world market operates as an ideal mathematical model without independent scientific verification.
How Probability Changes When the Number of Outcomes Changes
To see how sample space size alters probability, compare different number formats under the same equal-likelihood assumption:
1. Single Ank (One Digit: 0 to 9)
When evaluating a single digit from 0 through 9:
- Total outcomes =
10 - Favourable outcome =
1 - Theoretical Probability: $\frac{1}{10} = 10%$
- Odds against: $9 : 1$
2. Two-Digit Jodi (00 to 99)
When evaluating a two-digit pair:
- Total outcomes =
100 - Favourable outcome =
1 - Theoretical Probability: $\frac{1}{100} = 1%$
- Odds against: $99 : 1$
3. Three-Digit Pana Formats
A pana consists of three digits arranged in ascending order — where the app's own convention ranks 0 as the highest digit, written after 9, so 500 and 120 count as ordered while plain digit comparison would reject them. Depending on whether digits repeat, panas fall into distinct mathematical categories (as detailed in Matka Bet Types Explained); the convention and the 220 list it produces are worked through from the shipped app in Understanding "Single Digit" and "Double Patti" game formats:
- Single Pana: All three digits are unique (e.g.,
123,346). There are 120 possible unique single panas. - Double Pana: Two digits match (e.g.,
112,500). There are 90 possible double panas. - Triple Pana: All three digits match (e.g.,
111,777). There are only 10 triple panas (000through999). - Total distinct panas: $120 + 90 + 10 = 220$ total valid pana combinations.
Under an idealized model where all 220 pana combinations were equally likely, any single pana would have a theoretical probability of: $\text{P(Specific Pana)} = \frac{1}{220} \approx 0.455%$ $\text{Odds Against Specific Pana} = 219 : 1$
As the sample space expands from 10 to 100 to 220, the mathematical probability of any individual outcome drops dramatically.
Why Historical Matka Charts Cannot Guarantee a Future Result
One of the most persistent misunderstandings among beginners is treating historical chart archives as predictive roadmaps. People examine multi-week grids on the Kalyan pana chart or the master charts directory hoping to identify "repeating cycles" or "overdue numbers."
From a mathematical and statistical perspective, this approach suffers from foundational flaws:
1. The Principle of Independent Events
In probability theory, two events are independent if the occurrence of one does not affect the probability of the other: $P(A \mid B) = P(A)$ When events are independent, the system has no memory. If you flip a fair coin and get heads five times in a row, the probability of heads on the sixth flip remains exactly $50%$. The coin does not remember past flips, feels no obligation to balance the count, and cannot compensate for prior outcomes.
2. The Gambler's Fallacy
The mistaken belief that a random event is more likely to happen because it has not happened recently is known in statistics as the Gambler's Fallacy.
If the Jodi 48 has not appeared in a market for three months, beginners often declare that 48 is "due." In reality, under an independent model, 48 has the exact same $1%$ probability on every single draw as any other combination. A past absence does not create future gravity.
3. The Clustering Illusion
Humans have evolved acute pattern-recognition capabilities. When we look at a large table of numbers, our brains naturally spot diagonal lines, repeated digits, alternating sequences, or red pana clusters.
Statistical research demonstrates that completely random data naturally contains clusters, streaks, and apparent symmetries. Seeing three double panas appear in a single week does not indicate a predictable mathematical rhythm; it is a normal characteristic of random dispersion. This effect has been measured directly on the declared records published on this site — uneven digit counts, repeated Jodis, and short streaks all landing inside the range chance predicts — in The Role of Probability in Number Games.
4. Historical Records vs. Forward Predictors
A chart on Mama567 is an archive—a truthful, chronological record of what already occurred. It tells you what happened yesterday; it contains zero arithmetic instructions about what will occur tomorrow. Anyone marketing a "sure-shot formula" based on chart history is selling a mathematical impossibility.
Probability, Payout Rates and Expected Value
Another major source of confusion is equating advertised payout rates with true mathematical probability.
On the Mama567 homepage, the public Gate Rates table lists commercial multipliers such as:
- Single Digit:
1 RS KA 9.5 Rs - Jodi Digits:
1 RS KA 95 Rs - Single Pana:
1 RS KA 150 Rs - Double Pana:
1 RS KA 300 Rs
Payout Rate Does Not Equal Mathematical Odds
Notice the arithmetic comparison between payout rates and theoretical odds:
| Format | Theoretical Outcomes | True Mathematical Odds Against | Advertised Payout Rate | Theoretical House Edge |
|---|---|---|---|---|
| Single Digit | 10 | $9 : 1$ | $9.5$ for $1$ (effective return) | ~5% |
| Jodi | 100 | $99 : 1$ | $95$ for $1$ | ~5% |
| Single Pana | 220 (total pool) | $219 : 1$ | $150$ for $1$ | ~31.8% |
If the payout for a Jodi were mathematically "fair" (zero house advantage), winning would return 100 for 1 to balance the 99-to-1 odds against. The gap between the mathematical probability ($1/100$) and the commercial payout ($95$) represents the operator margin.
The Concept of Expected Value ($EV$)
In statistics, Expected Value ($EV$) calculates the average mathematical return of an event repeated infinitely under defined assumptions:
$\text{EV} = (P(\text{Win}) \times \text{Net Win}) - (P(\text{Loss}) \times \text{Stake})$
Under an idealized 100-outcome Jodi model with a 95-for-1 return on a ₹1 stake:
- $P(\text{Win}) = \frac{1}{100} = 0.01$; Net Win = ₹94
- $P(\text{Loss}) = \frac{99}{100} = 0.99$; Stake Loss = ₹1
- Calculation: $\text{EV} = (0.01 \times 94) - (0.99 \times 1) = 0.94 - 0.99 = -0.05 \text{ Rs}$
An expected value of -₹0.05 per Rupee staked confirms that over time, the mathematical design guarantees a negative return for participants. No amount of chart reading, mathematical formulas, or sequence guessing can convert a mathematically negative-expectation game into a positive one.
Common Probability Misconceptions
To summarize the mathematical principles, keep these facts in mind whenever evaluating number claims:
- "Infrequent numbers are overdue."
Correction: In independent events, outcomes do not become more likely because they have been absent. Every draw is independent. - "Recent repetition proves a hot trend."
Correction: A repeated outcome is a historical artifact. In an independent model, previous draws exert zero pull on the next declaration. - "Visual chart patterns prove predictability."
Correction: Random distribution naturally forms visual clusters. A recognizable shape in a grid is not evidence of a predictive rule. - "A formula can calculate the next result."
Correction: Mathematical formulas can calculate the probability of a model; they cannot predict which random outcome will materialize in a specific trial. - "Payout rates reflect true probability."
Correction: Payout rates are commercial parameters designed with an operator margin; they do not represent unbiased arithmetic odds.
Frequently Asked Questions
What does probability mean in Matka number formats?
Probability is a numerical measure between 0 and 1 (or 0% to 100%) that quantifies how likely an event is under a defined model. It divides favourable outcomes by total possible outcomes.
What is the difference between odds and probability?
Probability compares favourable outcomes against all possible outcomes (e.g., 1 out of 4, or 25%). Odds compare favourable outcomes directly against unfavourable outcomes (e.g., 1 to 3 in favour, or 3 to 1 against).
How many possible two-digit Jodi labels exist from 00 to 99?
There are exactly 100 possible two-digit combinations from 00 through 99. Under a theoretical uniform model where every label is equally likely, any specific Jodi has an idealized 1% probability.
Does a past Matka result change the probability of the next result?
Under standard models of independent trials, past results have no causal or arithmetic influence on future outcomes. Each session's probability remains unaffected by previous declarations.
Can historical Matka charts reliably predict future outcomes?
No. Historical charts on Mama567 are records of past declarations. While they help readers verify historical records, they cannot arithmeticly forecast or guarantee future random outcomes.
What is the difference between probability and payout rate?
Probability is the theoretical likelihood of an outcome occurring. A payout rate is a commercial payment multiplier established by game organizers, typically set below the true mathematical odds to retain an operational margin.
What does expected value mean in mathematics?
Expected value is the theoretical long-term average outcome per trial across repeated events, calculated by weighting potential gains and losses by their respective probabilities.
Does a low-frequency number become more likely because it has not appeared recently?
No. Believing that a number is "overdue" is known as the Gambler's Fallacy. In independent random events, the likelihood of an outcome remains constant regardless of past absence.
Conclusion
Understanding the mathematics of probability and odds provides clarity and helps demystify the numerical formats used across satta matka platforms.
By distinguishing between probability (likelihood within a sample space), odds (ratios of wins to losses), payout rates (commercial returns), and historical frequency (past records), readers can appreciate uncertainty for what it is. Historical boards and panel charts serve a clear, practical purpose as transparent record archives, but they are not mathematical crystal balls. In any system governed by chance, mathematical laws confirm that past events cannot dictate future outcomes.
To explore real chart layouts and understand how daily results are structured, visit the Mama567 home page, consult our master charts directory, or review our practical guide to How to Read a Kalyan Panel Chart.
Educational Notice: Mama567 is an informational platform publishing historical market records and declaration charts. Mama567 does not accept wagers, offer gaming services, or provide winning predictions. Satta matka is illegal in most Indian states. Content is intended strictly for adults aged 18 and older. Play responsibly and observe all local laws.