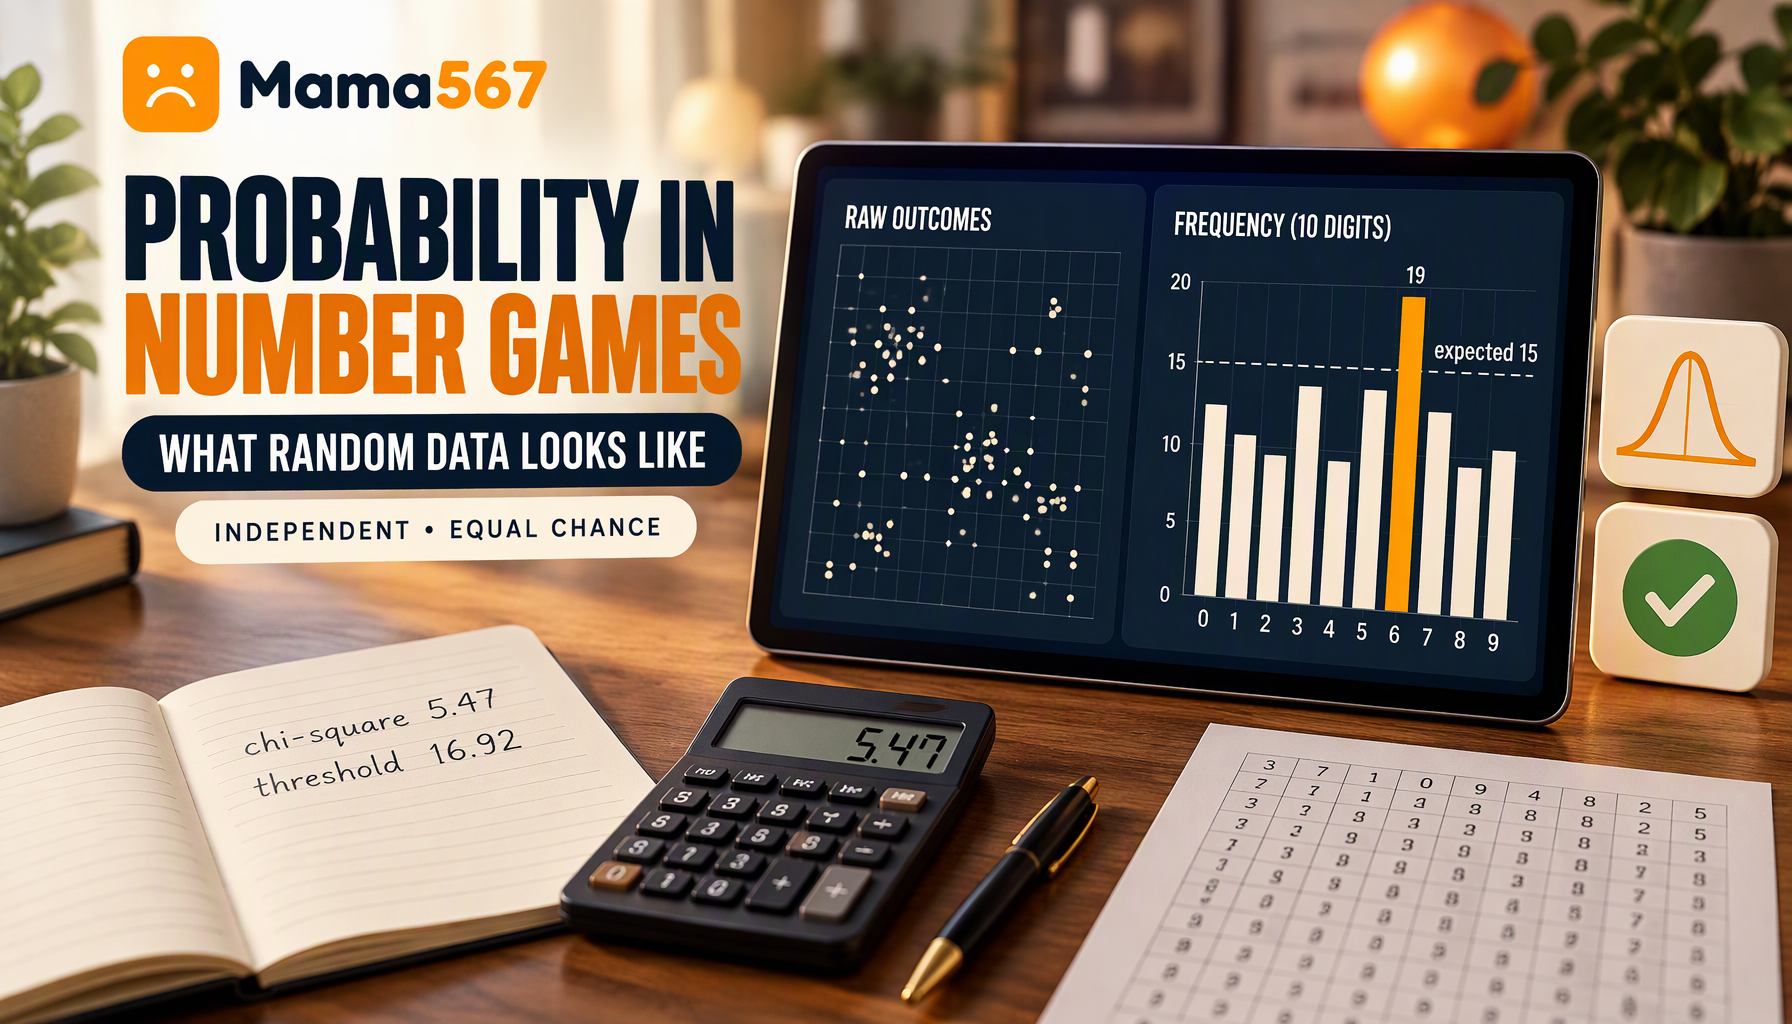
Probability is the part of this subject that can be checked rather than believed, and what it says about number games is narrow but firm: each declaration is independent, every outcome in a draw is equally possible, and the clusters, streaks and repeats visible in any real chart are what randomness looks like up close — not evidence of something behind it.
This overview is deliberately non-promotional. It explains the ideas, then runs them against the 75 declared results this site currently publishes, so the abstractions can be seen in the actual data rather than asserted.
The two ideas that carry everything
Independence. Two events are independent when knowing one tells you nothing about the other. Consecutive declarations in these markets are independent in the only sense a reader can test: there is no mechanism connecting them. A chart records what came out; nothing in the process reads the chart before drawing.
Equal possibility. An ank is the last digit of a sum, so ten values are available, 0 through 9, and no digit has a structural advantage. A jodi is two such digits written in order, so 100 values are available, 00 through 99. Those counts are arithmetic, not opinion — and they are why the phrase "lucky number" has no place in a probability discussion.
From those two ideas, everything misleading about this game follows. A number that has not appeared in a fortnight is not "due"; a number that appeared three times this week is not "running"; a chart with an obvious cluster in it is not showing a tendency. Each of those sentences is the same error wearing different clothes: treating an independent draw as if it remembered.
What random data actually looks like
People expect randomness to look even. It does not. In a short sample, unevenness is the normal case, and three effects do most of the damage to a reader's judgement:
- Uneven counts. Toss a coin 20 times and getting 14 heads is unremarkable, even though 10 is "expected". Expectation is a centre, not a forecast.
- Clusters and streaks. Runs of similar results appear in random sequences more often than intuition accepts, because any arrangement that looks like a pattern is one of many arrangements that look like a pattern.
- Collisions. Repeated values in a modest number of draws are the birthday-problem effect: with 100 possible jodis and 75 draws, you should expect a lot of repetition, not be surprised by it.
All three are testable against real records, so here they are.
A test on the results this site publishes
The dataset behind every chart on Mama567 currently holds 75 complete declared records across 19 markets, covering 10–14 September 2026. Each record supplies an open pana and a close pana, so the 150 anks derived from them are 150 observations of a ten-way outcome — small, but large enough to show what chance looks like.
Counting how often each digit appeared
| Measure | This dataset |
|---|---|
| Complete declared records read | 75 |
| Ank observations (open + close per record) | 150 |
| Expected count per digit | 15.0 |
| Observed range across digits 0–9 | 9 to 19 |
| Normal spread of a count this size (±2 standard deviations) | 7.7 to 22.3 |
| Chi-square statistic (9 degrees of freedom) | 5.47 |
| Value needed to reach the conventional 5% threshold | 16.92 |
Every digit landed inside the band. The chi-square test — the standard way of asking "is this spread bigger than chance explains?" — returned 5.47 where 16.92 would be needed to call the data suspicious, and 5.47 sits below the average value such a test produces when nothing is going on. Read plainly: the most uneven-looking part of this site's own data is unremarkable. A reader who had picked digit 1 as "hot" (19 appearances) and digit 6 as "cold" (9) would have been describing noise, and would have had nothing to act on anyway, since noise does not carry forward into the next draw.
Counting repeats
The 75 records produced only 50 distinct jodis. Pure arithmetic predicts 52.9 distinct values for 75 draws from 100 equally possible outcomes, so the observed repetition is not merely explainable by chance — it is slightly less clustered than chance expects. The most-repeated jodi appeared 4 times; simulating 200,000 independent runs of the same experiment shows a value repeating 4 or more times in 52.1% of runs, with an average maximum of 3.6. A four-time repeat is closer to a coin flip than a discovery.
Counting streaks
Comparing each market's consecutive declarations, the open ank repeated from one draw to the next 7 times out of 56 opportunities — 12.5% against the 10% that independence predicts, a distance of 0.6 standard deviations. In other words: within the noise of a sample this size, exactly as often as chance.
Three findings, one conclusion. The patterns a reader can spot in these charts are the ordinary texture of random data, and they were measurable here precisely because the records are honest about being small.
What probability cannot tell you
Honesty requires stating the limits of the test above, because probability arguments fail in two distinct ways and only one of them is visible in the data.
A perfectly fair mechanism produces uneven small samples, which is what was just demonstrated. But an unfair mechanism would also produce uneven samples — and a sample this small cannot tell those apart, because "no bias detected" and "no bias present" are different claims. This site publishes results as reported by external market organizers; it does not operate a random number generator and does not publish distribution audits, so nobody reading these charts — including the site — can verify the mechanism behind them. That is the honest boundary, and it is the same one our treatment of odds and payout rates draws.
It also has a practical consequence worth stating without softening: the game has a long documented history of number-fixing, and where a draw is manipulated, "the numbers are random" is not just wrong but the specific thing a defrauded player was told. The safe reading of any chart is therefore the modest one — these are records of declarations, and nothing more.
Why study charts at all, then
Because reading is a real skill with a real payoff, and prediction is neither available nor needed to make charts worth studying:
- Fluency. A chart that takes a newcomer a minute to parse takes a regular reader three seconds, and that difference is entirely notation — pana, jodi and ank — not insight.
- Verification. Because the jodi is derived from the two panas, any line on this site can be checked by adding digits and keeping the last. A forwarded screenshot cannot be. That arithmetic is the closest thing to a defence a reader has, and how to read satta matka charts walks through it.
- Record. "What has Kalyan declared this week?" is a legitimate question with a factual answer, and a chart is the honest form of that answer.
What changes when you stop expecting a forecast is the standard you apply to the page: you are checking whether the record is complete and dated, not whether it is friendly. And if the follow-up question is how much history it would actually take before a frequency count means anything, how to use historical charts to understand market patterns works that out against this site's own 75 complete records instead of appealing to tradition.
Four fallacies, named
- The gambler's fallacy — a number is "due". Fails because draws do not remember.
- The hot-hand error — a number is "running". Fails for the same reason, pointed the other way.
- Pattern apophenia — a diagonal, a shape, a symmetry in the grid means something. Fails because the number of arrangements that look meaningful is enormous, which is exactly what the repeat counts above measure.
- The payout confusion — a large rate implies a real chance. A rate is a commercial multiplier, not a probability; the two live in different columns and only the second one governs how often you win.
The common fix is the same in every case: ask what the count of possibilities is, and ask what the last result could possibly know about the next one.
The useful conclusion
Probability in a number game is not a tool for finding an edge; it is the reason there is no edge to find. Anyone offering a method has to explain how an independent draw acquires memory, and nobody has. For the reader who wants to follow these markets seriously, the practical version is unglamorous and works: study the past declarations on our historical charts for what they record, verify them by arithmetic, keep the dates straight, and treat every claim of a predictable number as the thing it is.
For the contact routes this site actually offers, and why no page here prints a support number, see How to contact Mama567 customer support. For the denominator side of that argument — why 220 recorded forms and 1,000 written triples are one space counted at two stages, and what each count can and cannot license — see Understanding “Single Digit” and “Double Patti” game formats. The vocabulary those two counts are written in — pana, patti, ank, jodi and the sangam readings built on top of them — is collected in the satta matka terms glossary. The checks that separate a real results page from a clone — certificate, timestamps, rates and a named contact — are run end to end in How to verify a satta matka website.
The mechanism question, which this article deliberately leaves open, is the subject of Random number generation explained — it quantifies how blind a test on 75 records is (a market drawing one ank at half the fair rate moves the statistic by 2.08 against a fair spread of 4.24) and why nothing on a results site can be a generator audit. For the same reading discipline applied to one market family, see Supreme Day and Night: What You Need to Know.
Random data looks clustered — as the numbers above show, even when it is not. That is the whole lesson, and it is worth more than any system. Information only, 18+; satta matka is illegal in most Indian states, and the mathematics here favours no one who plays it.