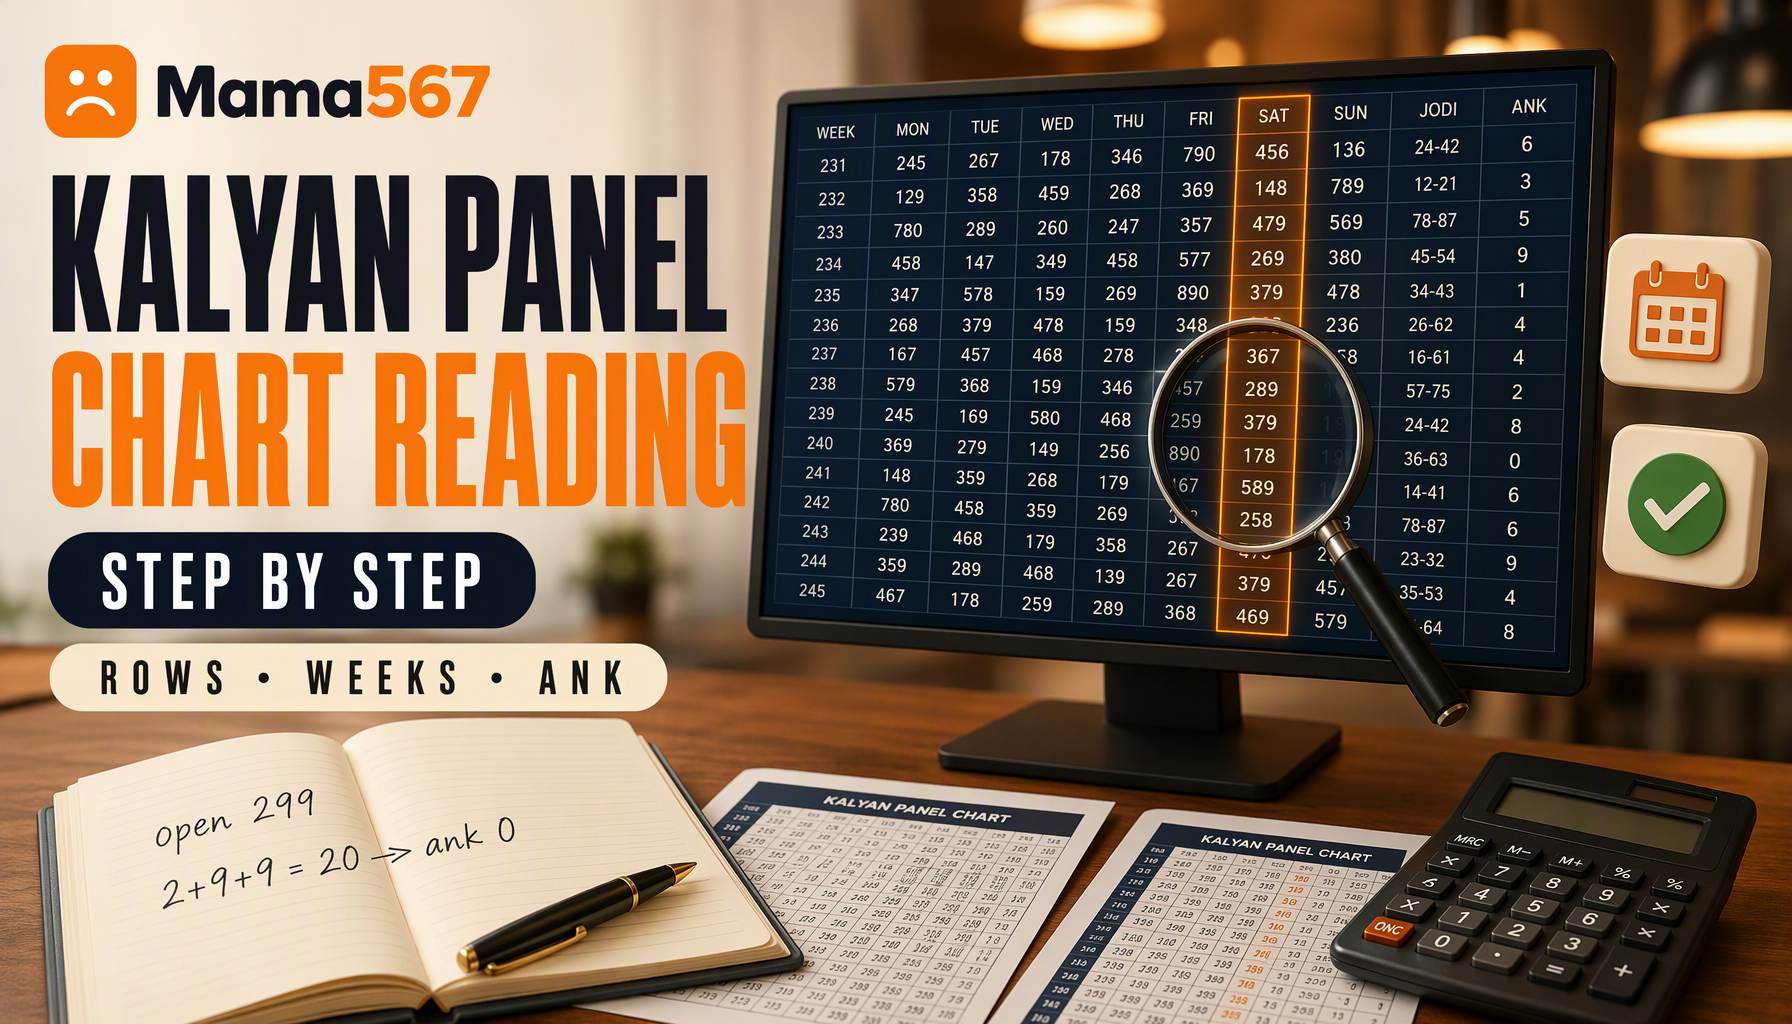
A Kalyan panel chart is the weekly grid that lays out every Kalyan declaration in one view: open pana, close pana, and the jodi they combine into. If you have ever opened the chart and seen nothing but three-digit numbers and asterisks, this step-by-step guide is for you. We will use the same layout as the Mama567 Kalyan pana chart, so you can follow along on the live page.
New to the game itself? Start with What is Satta Matka? first — this post assumes you know the basic vocabulary.
What "panel chart" means
"Panel" is just another word for the result board: the block that shows a market's open and close declarations side by side. A Kalyan panel chart is therefore the week-by-week record of those two declarations, arranged so you can scan many days at once instead of reading one result at a time.
Kalyan is one of the most-followed markets, which is why its panel chart is the one people learn to read first. The format is identical across every market, so once it clicks here, it clicks everywhere.
Where to find the Kalyan panel chart
There are two Kalyan boards, and both are reachable three ways:
- The pana chart at
/pana/kalyan/— the full panel: each weekday cell stacks the open pana, the jodi they make, and the close pana underneath. This is the chart this guide walks through. - The jodi chart at
/jodi/kalyan/— the same week condensed to two-digit pairs. - The charts index at
/charts/lists every market's pana and jodi board in one place, and the market cards on the home page show each market's live status and bid timings.
Bookmark whichever you check most often. On a phone, the app lands on the same data in fewer taps, which matters when you are trying to catch a declaration the moment it posts.
The layout at a glance
Open the chart and you will see a simple table:
- Seven columns, labelled MON through SUN.
- One row per week — the newest week sits at the top, older weeks follow as you scroll down.
- Each cell holds that day's result. In the pana chart, the cell stacks three lines: the open pana on top, the jodi they combine into in the middle, and the close pana underneath.
Here is a sample week, written as open pana / close pana:
| MON | TUE | WED | THU | FRI | SAT | SUN |
|---|---|---|---|---|---|---|
| 346 / 128 | 500 / 613 | 247 / 358 | 110 / 429 | 681 / 236 | 792 / 148 | *** / *** |
Five numbers to read from that row: 346 is Monday's open pana, 128 is Monday's close pana, and Sunday has not declared yet.
How to read the Kalyan panel chart in five steps
Step 1 — Read the open pana
The top number in each cell is the open pana: the three-digit result declared at the market's opening declaration. On Monday above, the open pana is 346.
Step 2 — Read the close pana
The bottom number is the close pana, declared later in the session. Monday's close pana is 128. Order matters: top is always open, bottom is always close.
Step 3 — Reduce each pana to its ank
An ank is the single digit a pana reduces to. Add the pana's three digits and keep only the last digit of the total:
- Open 346 → 3 + 4 + 6 = 13 → ank 3
- Close 128 → 1 + 2 + 8 = 11 → ank 1
Step 4 — Combine the two anks into the jodi
Write the open ank first and the close ank second, and you have the day's jodi. For Monday: 3 and 1 make jodi 31.
Doing this for the whole sample week gives the jodi row — exactly what the Kalyan jodi chart displays:
| MON | TUE | WED | THU | FRI | SAT | SUN |
|---|---|---|---|---|---|---|
| 31 | 50 | 36 | 25 | 51 | 83 | ** |
| Day | Open pana | Open ank | Close pana | Close ank | Jodi |
|---|---|---|---|---|---|
| Mon | 346 | 3 | 128 | 1 | 31 |
| Tue | 500 | 5 | 613 | 0 | 50 |
| Wed | 247 | 3 | 358 | 6 | 36 |
| Thu | 110 | 2 | 429 | 5 | 25 |
| Fri | 681 | 5 | 236 | 1 | 51 |
| Sat | 792 | 8 | 148 | 3 | 83 |
Step 5 — Read the colours and the gaps
The chart uses colour and placeholders to carry extra information:
- Red pana — a pana in which two of the three digits match, such as 500, 299 or 343, appears in red. Black panas like 346 have no repeated digit.
- Jodi lines stay black — the red rule reads three-digit panas, so the middle line of a cell is printed in the normal colour.
- Asterisks —
***in a pana chart or**in a jodi chart means that slot has not been declared yet, either because the day has not arrived or the market did not run. It is a gap, not a number.
Checking your reading in two directions
The nicest thing about learning on the Kalyan panel is that you can verify yourself instantly, because the site publishes the same day twice.
Take Wednesday from the sample week: open 247, close 358.
- Add the open pana's digits: 2 + 4 + 7 = 13 → keep the last digit → ank 3.
- Add the close pana's digits: 3 + 5 + 8 = 16 → ank 6.
- Put them together: jodi 36.
- Now open the Kalyan jodi chart and find Wednesday's cell. If it reads 36, your arithmetic and your reading of the grid are both right.
Do this for a full week and the mechanics stop being something you have to think about. It also teaches you the one habit that separates a careful reader from a guessing one: the jodi is derived from the two panas, so if you ever have both charts in front of you, they must agree. When they do not, you have misread which number is open and which is close.
Single, double and triple panas
Every pana in a panel belongs to one of three shapes, and learning the shapes is what turns the colours from decoration into information:
| Shape | What it means | Example | Colour on the chart |
|---|---|---|---|
| Single pana | All three digits different | 346 | black |
| Double pana | One digit appears twice | 500, 334 | red |
| Triple pana | All three digits the same | 111 | red |
The full names and the bets built on them are covered in Matka Bet Types Explained; here you only need to recognise them inside a cell.
One subtlety is worth knowing before you trust the colour. The chart highlights a pana when any two of its three digits match, so 299, 500 and 111 are red — and so is 343, which repeats a digit without an adjacent pair. Position is not part of the rule; repetition is. Read the colour as this chart's own convention rather than a universal law: it exists to help your eye find the interesting cells quickly, not to classify every number for you.
The same rule does not extend to pairs. On the jodi chart every value is printed in the normal colour, doubles like 11 and 22 included, because the highlight is written for three-digit panas. Where you do meet a "red jodi" convention is on other sites' boards and in the betting vocabulary — Matka Bet Types Explained covers those shapes — but on Mama567 the colour never carries meaning, and it never changes what a jodi means.
Kalyan timings: when the panel fills in
A panel chart only changes when the market declares, and Kalyan declares twice per market day — once for the open, once for the close. That has two practical consequences for anyone reading the grid:
- A half-empty row is normal. If you look at today's row in the afternoon, the close column of numbers will still show
***for today even though the open has already posted. Nothing is broken; the second declaration simply has not happened yet. - Timing differs per market, not per chart. Kalyan and Kalyan Night are separate markets with separate schedules and separate histories, so their panels fill in at different moments. The exact Open Bids and Close Bids cut-offs for every market are printed on each card in the markets directory, and Understanding Open & Close Results and Market Timings explains how the cut-offs relate to declarations.
Common mistakes when reading the panel
- Swapping open and close. Top is open, bottom is close. Reversing them reverses the jodi — 31 becomes 13.
- Reading the jodi backwards. The jodi always runs open ank → close ank.
- Treating
***as a zero. An undeclared slot holds no information at all. - Mixing the two charts. The pana chart shows three-digit numbers; the jodi chart shows the two-digit result. They are the same data at different resolutions — see How to Read Satta Matka Pana & Jodi Charts for the general case.
- Assuming a blank week is a bad week. A row with several
***cells is usually just a week still in progress, or a market that did not run that day. It is missing data, not a pattern. - Carrying a Kalyan habit to another market. Every market uses the identical layout, but the schedules and the histories are separate. Reading Kalyan does not tell you anything about Milan Night's row.
Tips for scanning a panel chart faster
Once the five steps are automatic, these habits make a multi-week read much quicker:
- Work one column at a time, not one row. A column is the same weekday across weeks, which is far easier on the eye than jumping between dates.
- Start from the top-left and move down. The newest week is the first row, so a downward scan is a walk backwards in time.
- Read the anks out loud if you are new to it. Saying "two four seven, thirteen, three" is slower but it catches transposition errors that silent reading does not.
- Use the red cells as landmarks. A red pana stands out in a dense grid, which helps you keep your place when scanning several weeks.
- Open the jodi chart beside the pana chart. Two tabs, one week, instant cross-check — the single best drill for building speed.
What a panel chart is for — and what it is not
A panel chart is a record. It tells you, with certainty, what a market declared on a given weekday: one open pana, one close pana, one derived jodi. That is its entire job, and it does it well, which is why people who follow a market treat the panel as the reference copy of the week.
What it is not: a forecasting tool. A grid of past declarations shows you history in a convenient shape, and nothing more. Two numbers landing in a particular pattern last week has no arithmetic relationship with what will be drawn this week — each declaration is its own event, and the only honest statement a chart supports is "this is what already happened". Anyone presenting a panel as a prediction is describing something the chart cannot do.
The same caution applies to the surrounding vocabulary. Terms like panel, ank, jodi and sangam describe ways of reading results — short definitions are kept in the glossary, and Matka Bet Types Explained sets out what each one means. Knowing them helps you follow the conversation around a market; it does not change the odds of anything. If you do take part, treat the money as entertainment you can afford to lose, set a hard limit before you start, and stop when you reach it. Mama567 publishes results and charts only — no predictions, no guessing services, and no game operation, for adults 18 and over.
Reading the Kalyan panel chart in the app
The panel is the same grid on the Mama567 Android app as on the website — identical data, identical update moment — but the layout is worth knowing because a seven-column table is tight on a phone screen:
- The chart scrolls sideways. If you cannot see Sunday, drag the grid left; the weekday headers stay aligned with their columns.
- Each cell keeps the same open-above-close stacking, so the reading rules from this guide apply unchanged.
- Android: tap Download App on the home page for the official APK. Install only from the official site, and switch off the unknown-sources setting again afterwards — the app download guide covers the whole install and the file checks.
- iPhone or iPad: open the site in Safari and choose Add to Home Screen — no install, and the chart behaves like an app.
Nothing about reading a panel changes between the two, so learn it once here and it works everywhere.
Practise on a live week
The fastest way to lock this in is to take one real week from the chart and work through the five steps yourself — reduce each pana, build the jodi, and check it against the jodi chart. View the latest Kalyan chart now, check the latest results page for each market's newest declared line, and keep the open and close timings guide handy to know when each slot fills in. For deeper historical data literacy and pattern analysis tips, explore our Kalyan Chart Analysis Guide. Every other market works the same way from the charts page.
For information only. Mama567 publishes results and charts, and does not offer predictions or guessing services. Adults 18+.