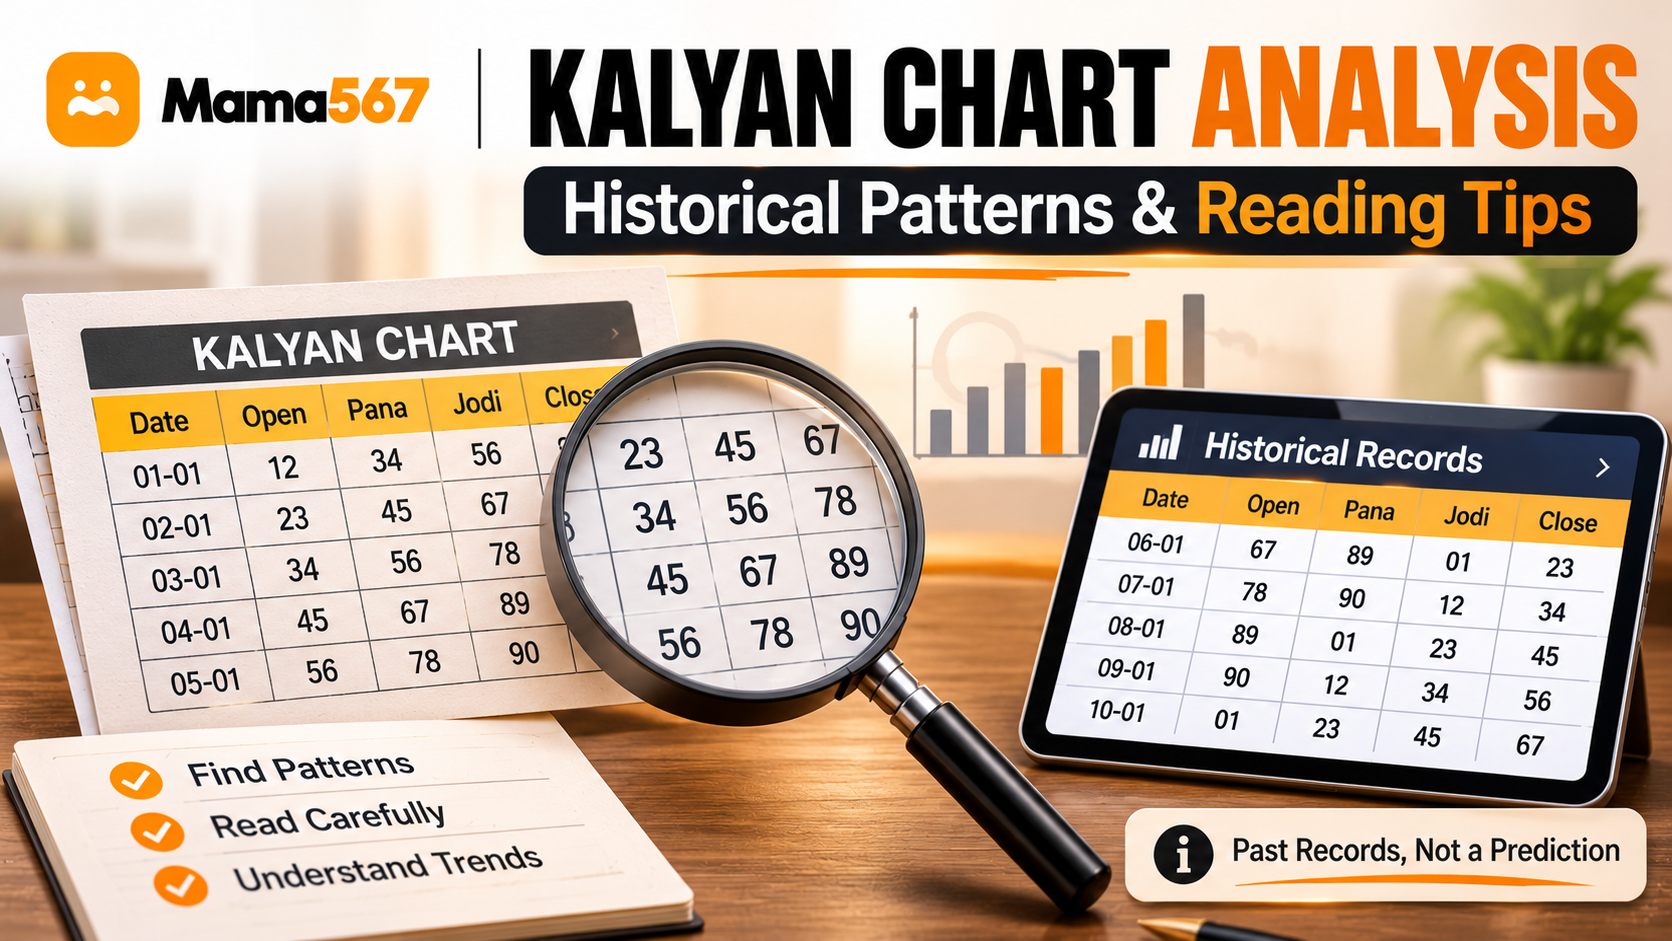
Historical chart records are among the most frequently visited resources in the number-games vertical. For newcomers searching for kalyan chart analysis tips, the sheer volume of numerical data—arranged in multi-digit strings across complex weekly tables—can appear daunting. Unfortunately, online discussions often surround these records with misleading terminology, claiming that obscure mathematical formulas or "secret lines" can forecast tomorrow’s declaration with certainty.
Approaching chart data with objective data literacy dispels these myths. A historical chart is a retrospective logbook of declared outcomes, not a crystal ball. Understanding how data is formatted, how digits are mathematically derived, and why the human brain naturally perceives phantom patterns in random sequences enables readers to interpret information clearly and critically.
This guide provides foundational, objective tips for reading Kalyan historical records, explains the mechanics of chart notation, and examines the crucial distinction between retrospective observation and predictive claims.
1. What a Historical Chart Actually Records
To analyze a dataset effectively, one must first understand what the dataset represents. In the case of the Kalyan Pana Chart and Kalyan Jodi Chart:
- Retrospective Log: The chart records declared numbers published by market operators for specific past dates. It is an immutable archive of historical events.
- The Standard Result Line: Each complete daily result follows a standardized eight-character format:
OOO-JJ-CCC.- Open Pana (
OOO): A three-digit combination declared during the market’s opening window (for Kalyan, typically 16:15 IST). - Jodi (
JJ): A two-digit number positioned centrally, representing the core declared pair. - Close Pana (
CCC): A three-digit combination declared during the market’s closing window (typically 18:15 IST).
- Open Pana (
For example, examine the verified historical records published in Mama567’s snapshot for Kalyan:
| Date | Open Pana | Derived Open Ank | Close Pana | Derived Close Ank | Resulting Jodi | Full Display |
|---|---|---|---|---|---|---|
| 2026-09-14 | 299 |
2 + 9 + 9 = 20 → 0 | 136 |
1 + 3 + 6 = 10 → 0 | 00 | 299-00-136 |
| 2026-09-12 | 560 |
5 + 6 + 0 = 11 → 1 | 249 |
2 + 4 + 9 = 15 → 5 | 15 | 560-15-249 |
| 2026-09-11 | 780 |
7 + 8 + 0 = 15 → 5 | 289 |
2 + 8 + 9 = 19 → 9 | 59 | 780-59-289 |
| 2026-09-10 | 579 |
5 + 7 + 9 = 21 → 1 | 113 |
1 + 1 + 3 = 05 → 5 | 15 | 579-15-113 |
Notice that every single row adheres to strict arithmetic consistency: the Jodi digits are not arbitrary independent numbers; they are the exact unit digits (digit sum modulo 10) of the corresponding three-digit panas. To learn more about this foundational arithmetic, explore our guide on Understanding Jodi and Pana.
2. How to Identify Dates, Labels, and Missing Values
When examining historical archives spanning months or years, beginners often stumble over formatting variations and missing rows.
Chronological Orientation
Historical tables are typically structured with the newest declarations at the bottom or top depending on the view. On Mama567 chart pages, records are organized chronologically within weekly columns (Monday through Saturday).
Interpreting Incomplete and Blank Cells
A blank cell or a placeholder containing asterisks (***-**-***) does not indicate missing or corrupted data. It typically signifies one of two routine conditions:
- Scheduled Non-Operational Days: While some daily markets run seven days a week, others observe scheduled rest days. For instance, Kalyan traditionally operates Monday through Saturday, leaving Sunday columns intentionally empty.
- Partial Declarations: During live market windows, a table may display
299-0*-***. This indicates that the opening session has concluded (producing open pana299and open ank0), but the closing session has not yet declared.
Misinterpreting a rest day as an omitted result leads to misaligned weekly comparisons. Always verify the explicit date header attached to each column before comparing results horizontally.
3. Distinguishing Observation from Prediction: The Core Data Literacy Rule
The single most critical concept in chart analysis is the fundamental distinction between descriptive observation and predictive inference.
[ Historical Record (What Happened) ]  =/=>  [ Future Probability (What Will Happen) ]
              |                                            |
      Empirical Fact                             Cognitive Projection
   (e.g., "15 appeared twice")                  (e.g., "15 is on a hot streak")
- Descriptive Observation: "In the four records between September 10 and September 14, the jodi
15appeared twice (on Sept 10 and Sept 12)." This is a factual, verifiable statement about the historical record. - Predictive Fallacy: "Because
15appeared twice in three days, the digit1is 'hot' and has a higher probability of appearing tomorrow." This is an invalid logical leap.
In true games of chance, random number generators or mechanical draws possess no memory. A physical ball drawn from a drum or a pseudorandom algorithm running on a server does not "know" what was declared yesterday. Each draw is an independent event. Observing a historical regularity does not alter the mathematical probabilities governing future trials.
4. Why Small Samples and Selected Examples Mislead
Human psychology is wired for pattern recognition. In evolutionary biology, identifying patterns helped humans survive; in statistical analysis, however, this tendency frequently manifests as cognitive biases:
Apophenia and the Clustering Illusion
Apophenia is the human tendency to perceive meaningful connections between unrelated things. If a reader looks at a hundred numbers, they will inevitably spot repeating digits, diagonal lines, ascending sequences, or symmetry (e.g., 15 followed by 59 followed by 15).
Because random distributions naturally cluster rather than spreading out into neat, alternating lines, clumps of identical digits occur regularly by pure chance. When an observer singles out these clusters and ignores the hundreds of non-repeating rows, they fall prey to selection bias.
The Gambler's Fallacy
Perhaps the most destructive misconception in number games is the belief that random events self-correct in the short run. If the open ank 7 has not appeared for 15 consecutive days, a beginner might assume it is "due" to drop.
In reality, on any fair draw with 10 possible single anks (0 through 9), the probability of drawing 7 remains exactly 1 in 10 (10%) on every single draw. The previous 15 draws have zero statistical influence on the 16th draw. For an in-depth mathematical exploration of these phenomena, read The Role of Probability in Number Games.
5. How to Compare Records Without Confusing Formats
When reviewing multiple historical surfaces, ensure you compare identical data structures:
- Do Not Mix Jodi Grids with Pana Panels: A Kalyan Jodi Chart presents a high-level two-digit summary. Comparing it directly to a Panel Chart without converting between pana and ank formats creates confusion.
- Watch for Market Name Variations: The satta matka vertical contains numerous similarly named markets (e.g., Kalyan Morning, Kalyan Day / Kalyan, and Kalyan Night). Each market operates on independent schedules, separate operator feeds, and distinct draw cycles. Conflating Kalyan Morning data with standard afternoon Kalyan charts invalidates your analysis.
- Verify the Source and "As-Of" Date: Always confirm that the chart you are reviewing matches verified operator declarations. As detailed in our Editorial & Data Policy, Mama567 stamps all chart surfaces with their latest declared result date to prevent outdated or manipulated numbers from circulating unchecked.
6. How to Describe Observed Patterns Responsibly
If you are logging or analyzing numerical data for academic, recreational, or journalistic purposes, describe your findings using disciplined, neutral language:
- Use Neutral Descriptors: Say "The digit 5 appeared in 3 of the last 10 close panas," rather than "5 is currently the strongest number."
- Acknowledge Sample Size Limitations: A sample of 20 or 50 draws is statistically insignificant for establishing underlying distribution characteristics. A minimum of thousands of trials is required before variance begins to smooth out.
- Reject Sure-Shot Terminology: Never adopt terms like "sure patti," "fixed open," or "guaranteed jodi." These phrases are marketing inventions designed to lure vulnerable individuals into paid tipping scams.
Responsible engagement with any number game begins with setting strict boundaries, acknowledging the total randomness of outcomes, and never risking money that cannot be affordably lost. Learn more about protecting yourself in our guide to Responsible Gaming Practices.