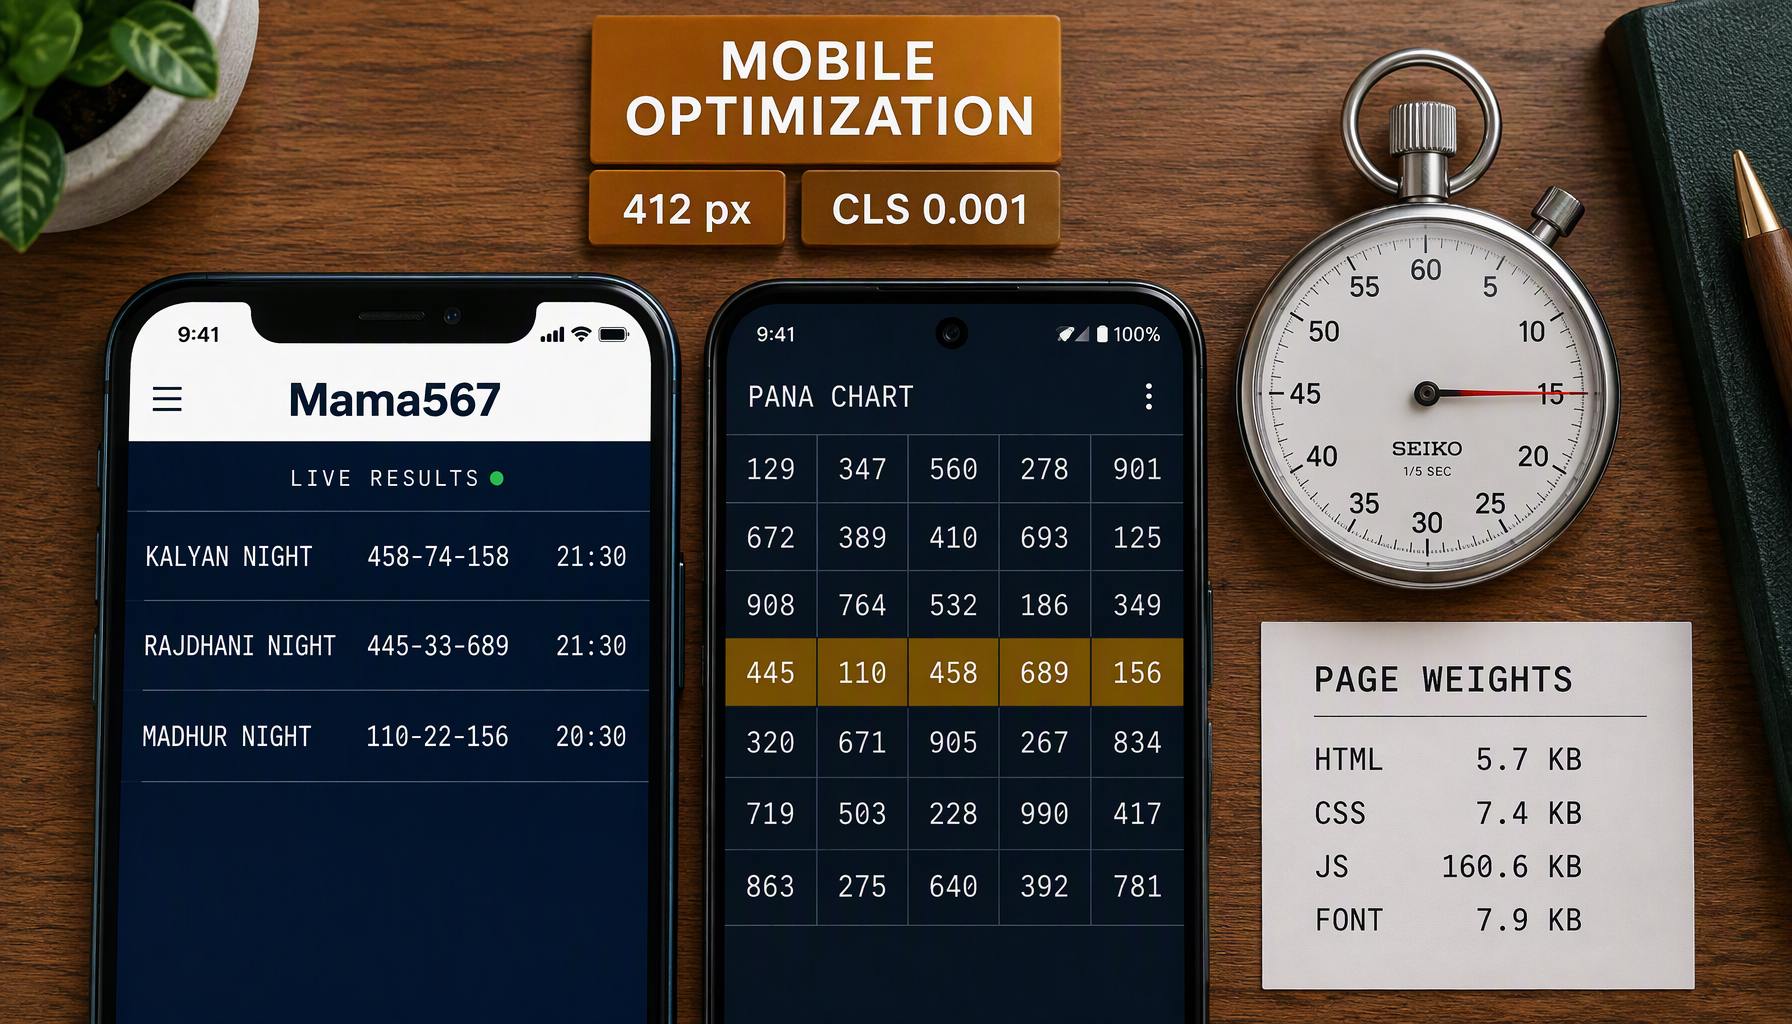
The claim, tested instead of asserted
"Mobile optimized" is the phrase every results site prints and almost none of them measures. This page is the measurement. Everything below comes from two places: this site's own build output, re-measured on 28 October 2026 against the current build, and HTTP responses from the live domain, read on 23 October 2026. Where a number is from a throttled lab run rather than real users, it says so — there is no analytics data on this site, so nothing here is a field measurement of other people's phones.
Start with the part that is not a preference. A results page has one job: get a declared number in front of someone who is checking it inside a narrow window.
| Homepage HTML | 34.0 KB raw → 5.5 KB compressed (Brotli) |
A chart page (/pana/kalyan/) |
35.6 KB raw → 5.7 KB compressed |
| Latest-results page | 29.1 KB raw → 4.4 KB compressed |
| Words of real content present before JavaScript runs | 1,255 on the results page, 1,826 on a chart page, 3,537 on the Rajdhani market guide |
| Shared assets every page also loads | 7.4 KB stylesheet + 232.5 KB script, compressed |
| Cumulative Layout Shift, throttled lab run | 0.001–0.011 on the four pages measured twice, 0.028 on one legacy guide post |
| Pages that scroll sideways at 412 px | none of the 97 built pages — the stylesheet forbids the pan |
| Built pages wider than the 412 px viewport | seven of the 97 built pages, measuring 462 to 710 px and clipped instead of scrollable |
Weights here are what the build output measures, in binary units: 1 KB means 1,024 bytes, which is what the commands at the bottom of this page print.
A dated correction, added 28 October 2026. Those two rows used to be one row reading none of the 94 built pages, which described scrolling and quietly not fitting. Re-measured with a scripted pass — headless Chrome over a 412 × 915 viewport, every routed page served from dist/ — seven pages put content past the right edge: /blog/kalyan-chart-analysis-historical-patterns-2026/ measures 710 px wide, /blog/step-by-step-kyc-verification-mama567-required-documents-2026/ 664 px, /blog/mama567-customer-support-review-live-chat-email-helpdesk-2026/ 600 px, /blog/understanding-matka-odds-probability-2026/ 524 px, /blog/understanding-single-ank-and-jodi-betting-formats-2026/ 510 px, /blog/mama567-latest-version-update-new-ui-features-speed-enhancements-2026/ 470 px and this page, /blog/why-mobile-optimization-matters-for-live-results/, 462 px. The offenders are the two things the stylesheet gives no horizontal scroll container to: fenced code blocks carrying a long line, and prose tables whose header row cannot compress. The page still cannot pan, because the stylesheet sets body { overflow-x: hidden } — so on a phone the content is cut off at the edge instead of being reachable with a swipe, which is the worse of the two failures and the reason the rows above now say what they say. Re-counted on 29 October 2026 over the 96 pages then built, with the same script and the same viewport: still exactly those seven, at the same widths, and no new page joined them — the day's new post, the evolution of digital satta matka platforms in India, is one of the pages that fits. A last pass the same day, over the 97 pages that include How to Set Up Notifications for Live Market Declarations: still exactly those seven, at the same widths, and no new page joined them — that page fits too.
The fourth row is the one that decides everything else. Those words exist because the pages are generated as static files at build time, not assembled in the browser.
Why prerendering is the whole argument
A matka result is text. Three digits, a jodi, a date. Text is what HTML is for, so the fastest possible architecture for a text payload is: put the text in the HTML the server already sent.
That is what this site does, and the split is measurable per surface. The chart pages, the results index, the markets directory and every blog post are prerendered from a committed data snapshot; the homepage board is the single surface that queries the feed while you watch, on a fifteen-second interval. Consequences, in the order they matter on a phone:
- A chart page's numbers are in the first bytes of the response. On a connection where the stylesheet has not landed yet, the page looks wrong and reads correctly.
- Because the data is in the HTML, a chart page does not need the API to be reachable to show the records it claims. It also cannot show anything newer than the snapshot, which is why every chart page prints the date of the newest row it actually holds.
- The live board pays for its freshness: three endpoints per cycle. Measured response bodies, Brotli or gzip as served: 1,895 bytes for the market feed, 367 for settings, 260 for rates — 2,522 bytes every fifteen seconds. Over an hour that is about 0.6 MB, and it is the only recurring cost on the site.
The trade-off is staleness, and it is documented rather than hidden: how to check live satta matka results covers which surface is current and which is a snapshot.
What a throttled phone actually waits for
Lab run setup, so you can repeat it — re-run on 24 October 2026 against the build that includes the two newest posts. Build the site, serve it, open a 412 × 915 viewport at 2.625 device pixels, four-times CPU slowdown, slow-3G network preset. For the first-visit column, serve the same dist/ on a port the browser has never used and install a largest-contentful-paint and layout-shift observer before the document's own scripts run, so the numbers come from the page rather than from a reload. For the repeat-visit column, record a performance trace of one reload on a port the browser has already visited, which is the revalidate-everything path the preview server's no-cache headers ask for.
| Page | LCP, first visit | LCP, repeat visit | What the LCP element is | CLS |
|---|---|---|---|---|
/pana/kalyan/ (no photography) |
5,160 ms | 4,550 ms | a text paragraph, 36,480 px² | 0.011 |
| Historical-charts post (hero 198,767 bytes) | 13,832 ms | 6,220 ms | the hero image, 81,819 px² | 0.001 |
| Rajdhani market guide (hero 232,454 bytes) | 14,880 ms | 6,278 ms | the hero image, 81,701 px² | 0.001 |
| This page (hero 244,408 bytes) | 5,232 ms | 4,272 ms | a text paragraph, 93,647 px² | 0.001 |
| Odds-and-probability guide (hero 1,797,962 bytes) | 5,340 ms | 4,746 ms | a text paragraph, 84,761 px² | 0.028 |
"First visit" is a browser that has never seen the site; "repeat visit" is the same page reloaded once, so every asset is revalidated. The second pass of the chart page came in at 4,492 ms, so read the repeat-visit column as ±90 ms rather than to the last digit.
Three conclusions, and the third one is not the one I expected.
The chart page has no image and is still the slow-looking one. 99% of its LCP is render delay, and the trace names exactly one render-blocking request: the site stylesheet, 45.8 KB raw, 7.4 KB compressed, total request duration 2,143 ms in that run. Estimated saving if it were out of the critical path: 1,969–1,980 ms of first paint, and that figure repeated itself on all five pages. This is the real mobile cost of a small static site — not bytes, but a blocking order.
A 200 KB hero costs a first-time reader about nine seconds. The two pages whose hero is the LCP element went from 13.8 and 14.9 seconds cold to 6.2 and 6.3 seconds warm. That gap is the image download, and it is the honest version of "image weight matters": not in the repeat-visit column, where the browser already holds the file, but the first time anyone opens the post on a metered connection.
The 1.76 MB hero never wins LCP at all, which is worse for it, not better. At a 412-pixel viewport the hero box paints 81,700-ish pixels squared, and on the odds guide the largest text block — 84,761 px² — is bigger, so the paragraph takes the LCP title at 5,340 ms and the PNG is not in that number. The file still arrives, still costs 1,797,962 bytes, and is still listed by the trace as a suspect in the one measurable shift on the page (0.0262 of the 0.028, which DevTools attributes first to poppins-800 landing late). A metric that ignores your heaviest asset is not evidence the asset is free.
Honest limits on this table: it is one host, one pass per cell, served over HTTP/1.1 by a local preview server, while production serves HTTP/2 through a CDN. Multiplexing changes the queueing, so expect the production numbers to be lower and differently shaped. Treat the 5.2-second and 14.9-second figures as a stress profile of the build output, not as a prediction of what a user in Bengaluru experiences. The byte weights and header policies below are not lab artifacts; those were read from the live site.
Where the weight actually is
The image directory on the built site: 42 files, 31.1 MB, of which seventeen PNGs account for 25.6 MB — 82.3% of everything in the folder, ranging from 685,325 to 1,995,143 bytes, with fifteen of them at 1.5 MB or heavier. They are not scattered across the site: every one is a hero from the -2026 batch of guide posts, exported before this site had a compression ladder. The twenty-five JPEGs, which is what every other post on the site uses, run from 184,902 to 252,769 bytes — so even the lightest PNG here is more than twice the heaviest JPEG. The duplication is worse than the format: a file of 1,626,877 bytes is stored twice under different names, and a file of 1,724,903 bytes is stored three times, which is 4.8 MB of the directory reproduced byte for byte. There are no WebP or AVIF files anywhere in the output, and none of the 143 <img> tags on the site carries a srcset; all 143 do carry width and height, which is why even the page whose hero paints last shifts by only 0.028 rather than a visible amount, and 50 of them are lazy-loaded.
So the picture (literally) is this: the site already has a working image budget — a generation ladder that compresses each new hero under 256 KB — and seventeen files that predate it.
For scripts, the numbers are 30 JavaScript files totalling 1,283.1 KB raw, but a single page loads one of them: the 902.6 KB entry bundle, 232.5 KB compressed, plus 7.4 KB of CSS. Route-level chunks for the board, the chart page and the blog renderer exist on disk and are only fetched when needed. The entry bundle is the one number here that moves every time the site publishes: the blog text is compiled into it, so a long guide makes the shared script a little heavier on every page, including the ones that are not guides — which is also why the weight sheet in the picture at the top of this page is dated to this build rather than quoted as a constant. Publishing this year's guide batch took it from 652.2 KB raw to 902.6 KB, or 170.6 KB to 232.5 KB compressed — a 38% heavier shared script on every page, from blog text added since this page was first measured.
The cache headers are the mobile-data story
Live responses from the deployed site, read on 23 October 2026:
| Surface | Cache-Control | Encoding | Size on the wire |
|---|---|---|---|
| HTML pages | public, max-age=0, must-revalidate |
Brotli | 7.1 KB home, 9.0 KB blog post |
| Blog images | public, max-age=86400, must-revalidate |
none | 1,995,143 bytes for the largest PNG |
| Fonts | public, max-age=31536000, immutable |
none | 7.9 KB per weight |
| API feed | absent | Brotli | 1,895 bytes per poll |
Read the middle row against the last one. A font is cached for a year. A blog image is re-validated every twenty-four hours — and if the browser's copy has expired, that revalidation re-downloads all 1,995,143 bytes of it on a metered connection, because PNG is not a delivery format and none of these files has a compressed alternative. The same page's text costs 9 KB.
The HTML row has a subtler cost: max-age=0, must-revalidate with no ETag or Last-Modified on the document means the browser cannot ask "has this changed?" — it has to fetch the body again to find out. For a 7 KB document that is a rounding error on Wi-Fi and a full round trip on a weak cell signal, paid on every navigation between pages of a site the reader has already visited.
The parts of mobile this site has not done
Not a laundry list — the six that the measurements above actually implicate.
- Tap targets. At a 412-pixel viewport the homepage exposes 168 interactive elements and 165 of them are under 44 pixels in height or width; the primary navigation rows measure 228 × 37–41. A chart page is the same story at 103 and 102. This is the clearest gap on the site, and it is a usability gap rather than a speed one.
- Chart density. The declared numbers render at 15 pixels and the weekday header and date column at 12, and the grid itself is 640 pixels wide inside a 369-pixel scroll box, so a week of seven columns takes deliberate panning to see at once. That is the right call for a seven-column week — the page never moves sideways — but small digits at arm's length have not been revisited since the layout was fixed.
- No preconnect to the API. The homepage polls
api.mama567apps.com, and the HTML contains zeropreconnectordns-prefetchhints for it, so the first poll pays name resolution and connection setup at the moment the reader is most likely looking for a number. - Four font weights nobody preloads. The shipped stylesheet declares six Poppins weights — 400, 500, 600, 700, 800, 900 — and its rules use 500, 600, 800 and 900 as well as the two that every page preloads. On the legacy odds guide the trace pins the page's one measurable shift, 0.0262 of its 0.028, to
poppins-800arriving after first paint. The fix is either to preload what the pages render or to stop declaring what they do not. - Motion and safe-area behaviour. The stylesheet contains no
prefers-reduced-motionquery, nosafe-area-insethandling and no dynamic-viewport units. The site has an animated marquee strip whose content measures 11,800 pixels wide inside a 412-pixel box; it is decoration, and it does not stop for readers who ask their system to reduce motion. - Content past the right edge. The 412 px census above found seven pages whose widest un-scrolled element runs from 377 to 694 pixels into a 412-pixel viewport, taking the document to 462–710 pixels.
body { overflow-x: hidden }hides the symptom: the reader cannot pan to what is there. The fix is a scroll container on the two offenders —preand the prosetable— not a change to the clip, which is doing useful work on every other page.
There is also no service worker and no web manifest, so nothing is pre-cached and a phone offers "Add to home screen" — a bookmark — rather than "Install". That is a deliberate scope decision rather than an oversight: an offline layer on a results site risks showing a stale number as if it were current, which is the one failure this project has spent its whole existence arguing against.
How to check any number here
npm run build          # prerenders 97 pages into dist/
npx vite preview --port 4187
Then in DevTools: throttling preset slow 3G, CPU 4×, viewport 412 × 915. For the repeat-visit column, record a navigation trace of one reload of http://localhost:4187/pana/kalyan/. For the first-visit column, serve the same dist/ on a port the browser has never opened — a different port is a different origin, so nothing is cached — and read largest-contentful-paint and layout-shift from a PerformanceObserver installed before the page's own scripts. Byte weights come from dist/ itself, and the header table comes from any HTTPS request to the live domain. Everything in this post was produced by those commands and a trace; nothing was estimated.
What this site's mobile story actually is
A prerendered, text-first results archive with a 232.5 KB script budget, near-zero layout shift, no sideways page scroll but seven pages of content clipped at the right edge, and seventeen images that need to be converted. The honest version of "lightning-fast" is narrower than the marketing version and more useful: the number you came for is in the HTML that arrives first.
- Homepage live board — the only surface that polls the feed while open.
- Latest results by market — the newest declared line for all 19 markets, in the smallest page on the site.
- Kalyan pana chart — the page used for the lab measurements above, including the swipeable 640-pixel table.
- 5 tips for navigating Mama567 on mobile — the same infrastructure from the reader's side.
- How to check live satta matka results — which surfaces are current and which are snapshots.
- Time Bazar market: open/close timings and chart analysis — the worked example of what prerendering costs: its chart pages print four declared cells with a 14 September newest date while the same feed carries 17 records and a 26 October line.
- How to read satta matka charts — what to do with that swipeable grid once you have it on screen.
- Historical satta matka charts — one of the five pages in the lab table above, and the newest example of the under-256 KB hero budget this post says the site already has.
- App vs website: performance and speed — the comparison this post deliberately does not settle. It answers a different question, and the two clients are not built alike: the app asks the API for its chart records, while the website's chart pages carry theirs in the HTML.
- The evolution of digital satta matka platforms in India — that asymmetry followed to its end: the archive the API serves, how many of its dated rows the website publishes and how many the app fetches live, and the unused client function sitting in
src/data/api.tsbetween the two.
Mama567 records declared results. It takes no wagers, sells no tips, and presents no number as likelier than another; satta matka is illegal in most Indian states, and nothing above is advice. 18+ only.
For information only. Mama567 publishes results and charts, and does not offer predictions or guessing services. Adults 18+.